It’s important that we remind ourselves that we always want to keep focus on the customer, what the customer needs and what the customer wants.
The decisions we make, they’re often based on other things or the factors than actually data. Decisions can be ego driven, this is where a person only thinks about what is important for that person. This can be the product that they are involved in, the project that they are involved in their team or their department. Decisions can be opinion driven, this means that they argue for what they think, not what they know, and then they can be authority driven. This means that there are leaders or managers that actually make the decisions and that they think they know best. Sometimes they even think they know the customer. And this is a huge pitfall. What we want is data driven decisions.
In order for agile to work, we need trust on a large scale. This means that we need objective decision making, not subjective.
A great way to do this is actually lean on quantitative and qualitative data. There are several ways to get this data. For example, user research, it is finding out what does a customer need and what do they actually want. The other one can be user testing. This is actually allowing the user to interact with your products in person and see how they behave. The next one can be collecting user data from the interface that you have or it can be through a questionnaire. These are just some examples of techniques. But the important thing here is the combination of these. That’s where the value really kicks in. It’s this holistic picture that we really want.
We need internal politics to be eliminated, and we need there to be no fear when we make decisions.
Again, we want decisions to be made objectively, not subjectively. What’s really important when we collect data is not to end up in this analysis paralysis face where we just collect, collect and collect data and we forget to think about and use the data as indicators to get us started. What we want to do is we want our hypotheses and then we want to use the data to prove those hypotheses right or wrong, and set the direction that we’re going in so we can move faster.
We want an experiment friendly culture, we want to build up a culture that asks questions and that is curious.
Check out our Master class on Udemy! Now only $9.99 instead of $199.99!
In order to accomplish this, we want an experiment friendly culture, we want to build up a culture that asks questions and that is curious. We want the people in our organizations to ask questions like what is the hypothesis? What did we learn? What we will try next. That’s an A and B test. Let’s try them both and compare. These are the types of actions and initiatives that we want from our employees and colleagues.
We need psychological safety and trust.
What is important when you do data driven decision making or development is to remind yourself that when you measure and you track, you do it in order to improve, not to punish. So. The key here is that you get what you measure and you only get what you measure. That’s why it’s so important to focus on the right things and to use the data that you are collecting for good and for developing the employees and creating engagement and curiosity. There’s actually a really interesting and bit sad story about this, about getting what you’re measuring. Ut was a company a while ago that figured out they needed a way to find all the bugs that they had in their system. So what they did is that they actually implemented a monetary incentive for testers to find bugs before it went into production. So what you ended up with here was testers and developers collaborating with the developers to make bugs deliberately. Then the testers discovered these bugs before they went into production. What happened? The tests got a bonus and then the tester shared that bonus with the developer. This is a good example of how you actually get what you measure. The company cannot blame the testers and developers for this kind of behavior because the organization itself created this kind of behavior with the way it works.
Frameworks for prioritization
When we want to have data driven decisions and development we want to focus on prioritization across the business. We want a holistic view, and we want everyone in the organization to really focus on what is most important to achieve your goals, not the individual goals or the team goals, but the organization goals as a whole. So here are a few frameworks on how you can do that. We will not go into depth with them, but these are very easy.
ICE
This is Impact c Confidence x Ease equals ice or your ice score. It’s pretty much an equation where the results will give you a score that will help you prioritize. So the impact here, it will demonstrate how much your idea will positively impact or affect the key metric. You are trying to improve the confidence here. It shows how sure you are about that impact. The EAS is about how easy it is to implement it, sort of an estimation of how much effort and resources that are required to implement the idea and then you end up with the score.

Rice
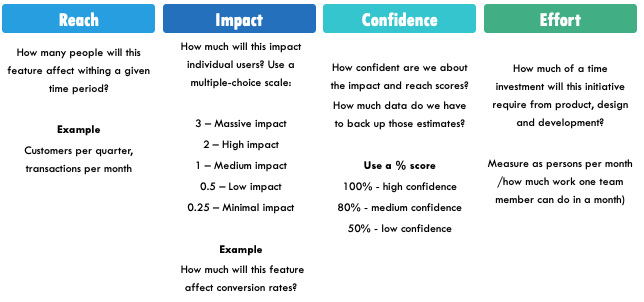
This is also an equation where you will end up with the rice score. So it’s reach, impact, confidence and effort.
- Reach is how many people will this feature impact within a given period
- Impact is how much this will impact individual users
- Confidence it is how confident are you about the impact and reach that you have estimated or scored
- Effort is how much of a time investment this initiative will require from product design and development


Cost of delay
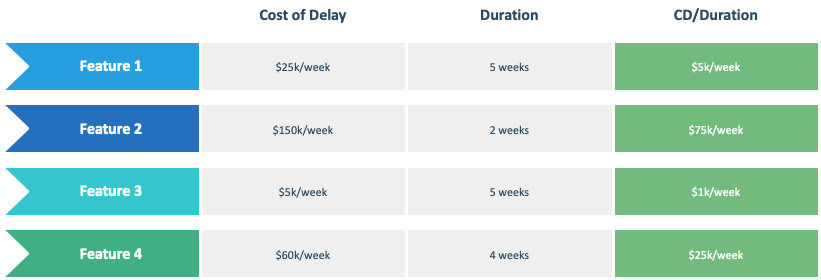
This is pretty much a method where you look at how much it will cost not to do something. So you will ask yourself questions like, what will this feature be worth if the product had it right now? How much would it be worth if this feature gets made earlier? And how much would it cost if it was made later than planned? The way you do this is by assigning a monetary value to each feature, by calculating how much time and team effort it will take to build it, and then the team and you can also assign a value to the feature in terms of how much they will be worth after they are built.

The KANO model
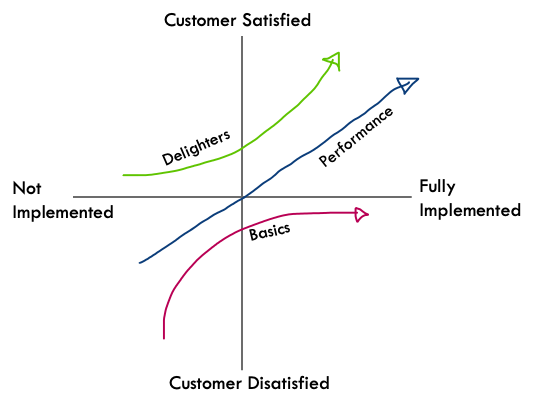
This model is based on three different buckets, so you have the must-have or the basic feature bucket, and this is where if you don’t have these features, your customers, they’re not even going to consider your product as an alternative. And then you have the second one, which is the performance features. And that’s kind of the features where the more you invest in those features, the higher level of customer satisfaction you get. And the last one is excitement, features or delighters as they are called Here. And these features, they will be this kind of pleasant surprise to the customers, things that they didn’t expect. But once they have them and once they’re provided, they will be really excited about them. So an example of a basic feature. It can, for example, be a seatbelt. Let’s say you’re looking for a car and a car you’re looking at. It doesn’t have seatbelts. Well, that’s kind of a basic feature, right? So you wouldn’t be too happy if the car had a one seat belt in the driver’s seat. You’d probably be a bit more satisfied, but it still didn’t have seatbelts for the rest of the four seats in the car. So it kind of still is useless if you have passengers. So if the car has five seat belts, your needs as a customer and consumer would be satisfied and you would be happy. But what if the car had 23 seatbelts? Well, it wouldn’t have made a difference to you, it would have cost the company a lot of money and in the end it would probably be really annoying if you had all those extra seat belts in the car, maybe even would have rendered you a bit more annoyed. Maybe you wouldn’t have bought the product in the first place. So this is a really good example of how it’s important for companies to find just what the customer needs in order to be able to do this. You develop a KANO questionnaire where you ask your customers how they would feel with or without a given feature.


